Laravel Debugbar is a great package to debug Laravel applications while developing. But it’s not just limited to debugging. You can use it to optimize the performance of your app a lot as well. Like,
- number of models loaded in a memory
- number of queries fired with timing
- memory used and more.
In short, we can have a complete view of what’s going on in each request.
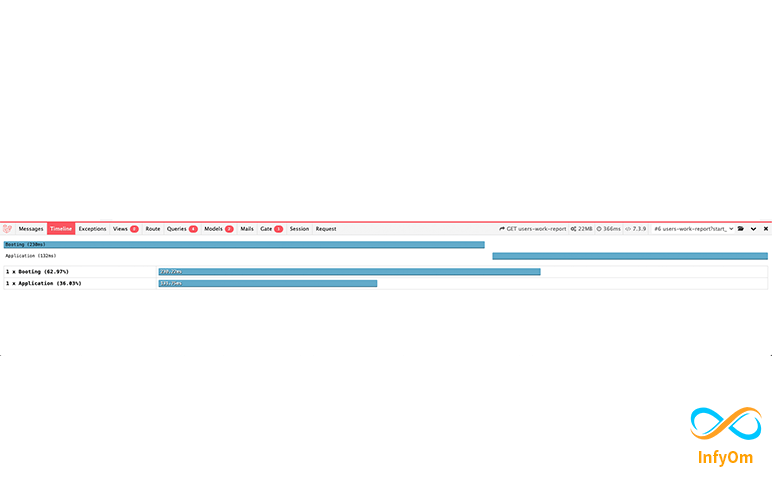
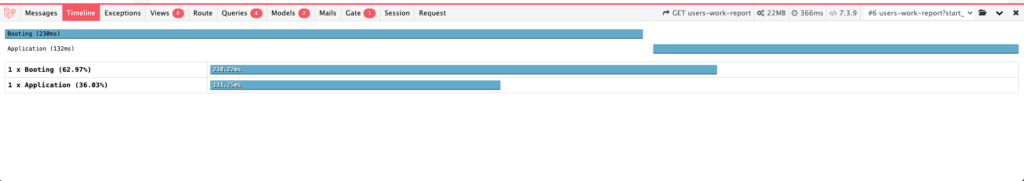
But the less known and used feature it gives is the Timeline tab. Where you can see how much time is taken for each request. And more than that, how much time Laravel took to boot up and how much time our other code has taken. Check the below screenshot.
Recently we came to the case, where one of our consultation clients’ CRM application was taking too much time on the first load. Their developers were not able to spot a problem. They checked queries and other stuff which looked completely good. so we were not sure where the time had been spent by the application.
That’s where debugbar came to rescue us. We used its measure function facility by which we can measure the time spent in each of the functions wherever we want to use. It gives simply two functions startMeasure and stopMeasure to measure the time spent between these two statements.
so we can put startMeasure in the starting of function and put stopMeasure at the end of the function which will render something like this in the timeline tab.
					public function searchClients($department)
{
    \Debugbar::startMeasure("searchClients'');
    // logic here

    \Debugbar::stopMeasure("searchClients");

    return $result;
}
Once we put this, we get a time that < code > searchClients is taking. Check the screenshot below,
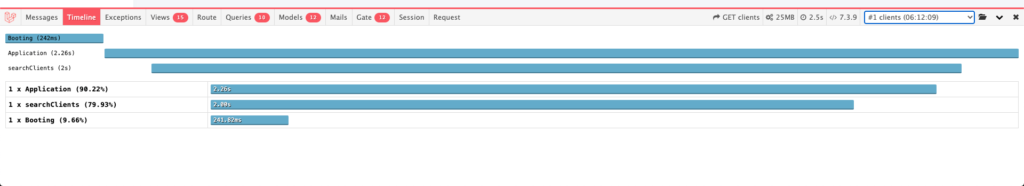
Hope this can help you to figure out what piece of code is taking the time and you can optimize it.
Happy Optimizing 🙂